Abstract
Content teams face the challenge of prioritizing editorial reviews across large portfolios of published pages. This study examines whether a supervised machine learning model can identify pages exhibiting observed search-performance decline more effectively than a rule-based baseline. Using 30,000 anonymized content-page observations, we evaluated a Random Forest classifier with client-grouped validation and compared its ranking performance against the baseline on the same held-out pages. The model achieved Precision@50 of 0.70 compared with 0.48 for the baseline, while a validation audit showed that random page splitting yielded a higher result of 0.88. These observations support investigating machine-learning-assisted editorial prioritization, but do not demonstrate future decline prediction, causal traffic improvements, or production readiness.
1. Introduction & research question
Content teams have finite time to investigate aging, underperforming, and potentially declining pages. Simple rules can support review, but ranking a large queue based on multiple signals may be useful where editorial capacity is limited.
Research question: Can a supervised model rank pages exhibiting observed search-performance decline more effectively than a transparent rule-based baseline when evaluated on previously unseen clients?
Our unit of analysis is a content page. The output is a ranked research queue accompanied by descriptive reason codes; the intended human action is to verify the evidence, inspect the page, and decide whether further editorial work is warranted.
2. Data & study scope
The primary model experiment uses the FlyRank internship's 30,000-page anonymized starter sample from 32 clients. The internship also provides access to the gated FlyRank internship warehouse. Separate warehouse data-contract work examined the fact_content_daily_performance table for March and April 2026, but those records were not the final model's training set.
| Dataset / period | Observed rows | Role |
|---|---|---|
| Starter sample | 30,000 pages | Final model comparison |
| Warehouse, March 1–31, 2026 | 9,841,378 daily records | Data-contract exploration |
| Warehouse, April 1–30, 2026 | 10,424,730 daily records | Data-contract exploration |
Of the starter pages, 16,262 have the decline label and 13,738 do not. The six model features are impressions_90d, avg_position, ctr, content_age_days, days_since_last_update, and word_count. The last feature is missing for 25.66% of pages; the model imputes it using training-set medians.
3. Methodology & validation
The target is trend_direction == "down": an observed search-impression decline category, not a validated future event. Fields derived from that target—trend_direction, trend_pct, and the binary label—are excluded from predictive inputs. client_id is used for grouping only, not as a feature.
The transparent baseline flags pages in positions 4–10 or 11–20 when their CTR is below the training-set median for that position band and they have at least 100 impressions. Eligible pages are ranked by impressions. The Random Forest uses 200 trees, a minimum of five samples per leaf, and training-only median imputation.
Both methods were evaluated on the same client-holdout test set using GroupShuffleSplit with a 25% test fraction and random seed 42. The split contains 22,885 training pages from 24 clients and 7,115 test pages from eight entirely unseen clients; client overlap is zero.
Precision@K is the proportion of pages labeled declining among the top K ranked pages. The primary metric is Precision@50; Precision@10 and @20 are supplementary.
4. Results & error analysis
| Evaluation method | P@10 | P@20 | P@50 |
|---|---|---|---|
| Heuristic baseline | 0.50 | 0.50 | 0.48 |
| Random Forest | 0.60 | 0.65 | 0.70 |
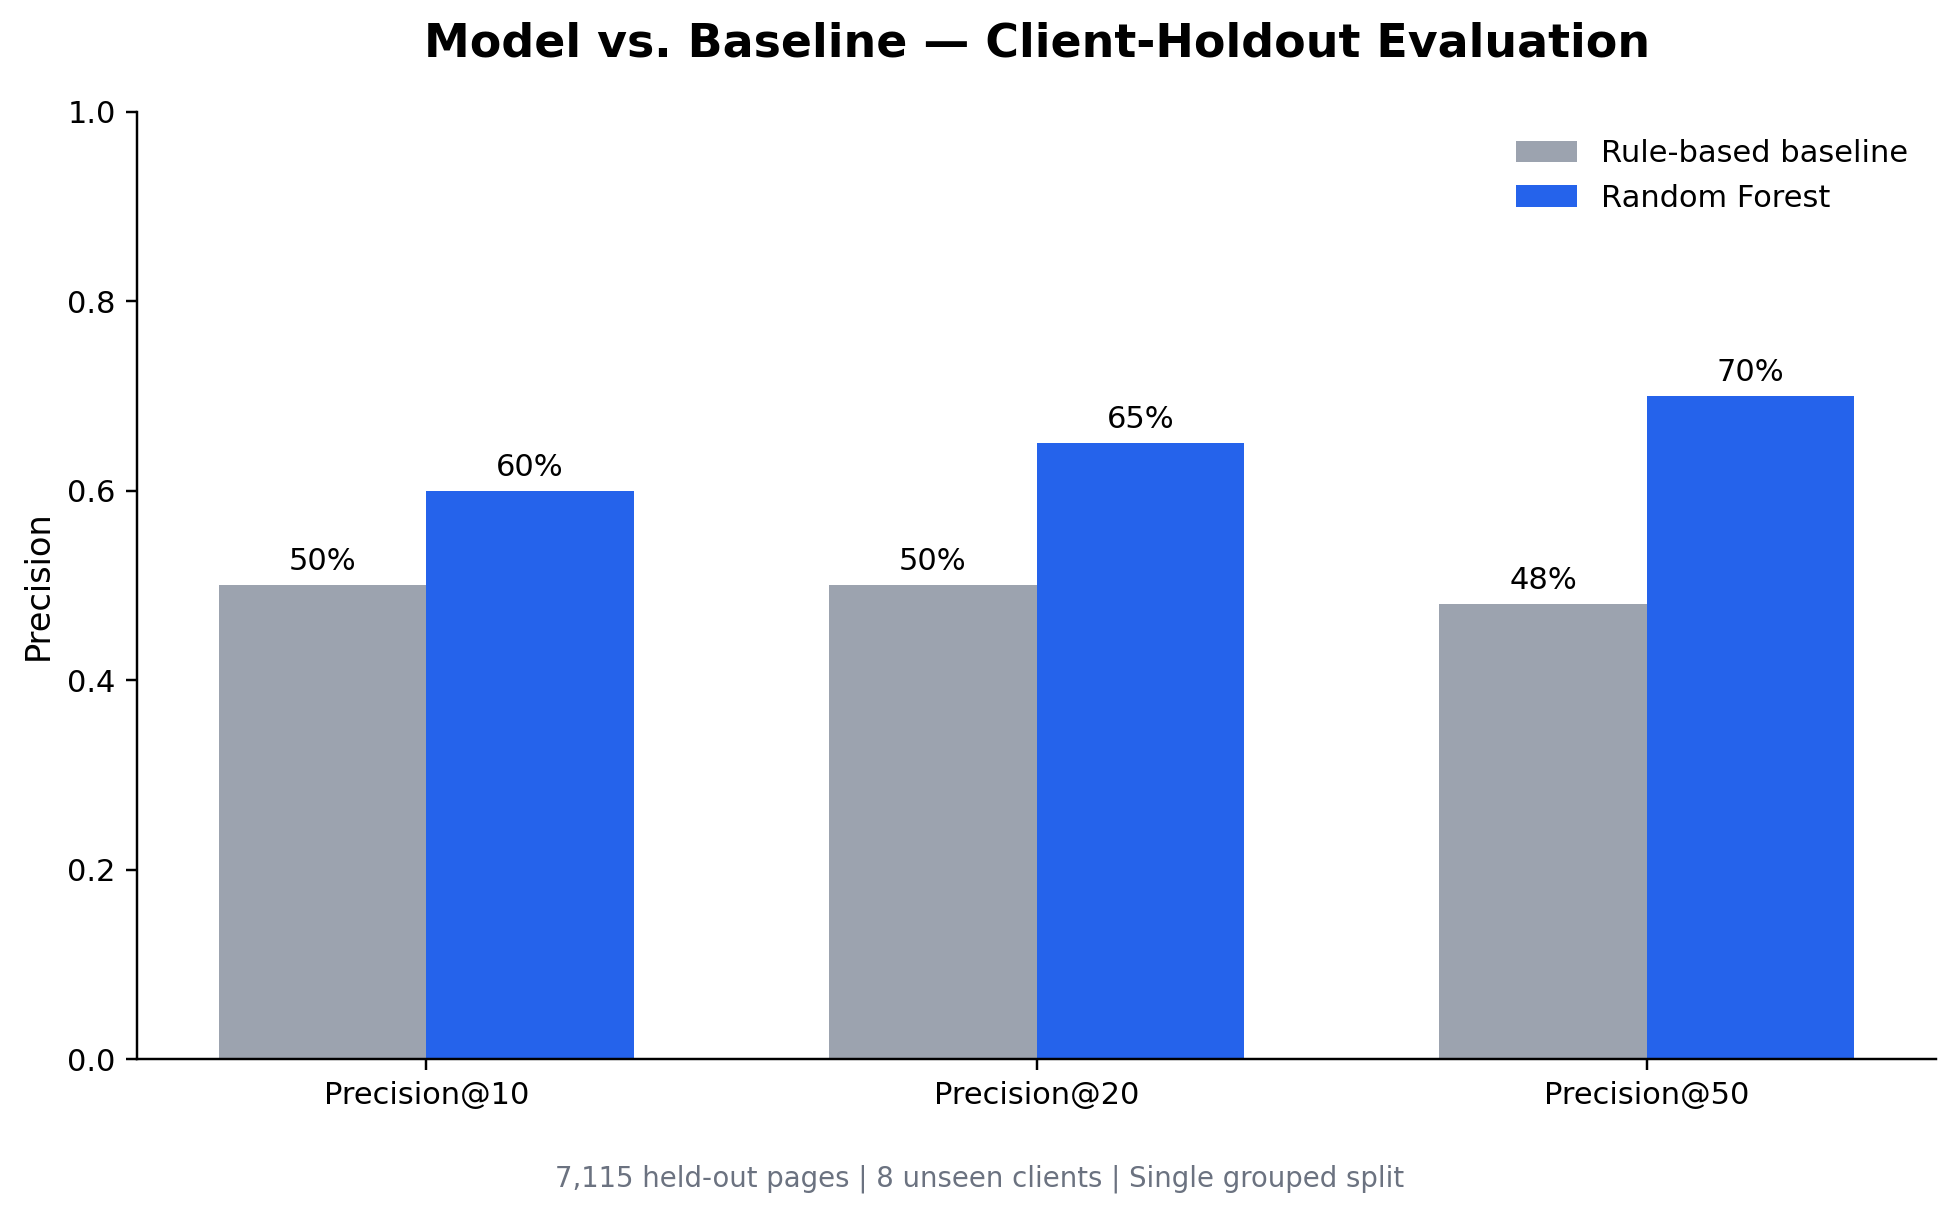
At K=50, the Random Forest identified 35 declining pages versus 24 for the baseline, a difference of 11 pages or 22 percentage points in precision. In the Random Forest's top 50, 15 pages were not labeled as declining, including highly ranked mistakes with scores above 0.90.
Why evaluation design matters
In a separate audit, a random page split yielded Random Forest Precision@50 of 0.88, while the client-holdout split yielded 0.70. The random split placed pages from 31 clients on both sides of the split. This difference suggests sensitivity to shared client characteristics, although the test populations differed, so it is not a clean causal estimate of leakage.
5. Limitations
- One grouped split. Results may vary with another client sample; repeated grouped evaluation is needed.
- Temporal uncertainty. The snapshot does not fully establish that all features predate the target outcome window, so future-prediction leakage cannot be ruled out.
- Missing values. Word count is missing for 25.66% of observations; median imputation is a pragmatic but imperfect choice.
- Proxy target. Observed decline is not synonymous with editorial need or actionable opportunity.
- Uncalibrated ranking scores. Several false positives had high scores, and the scores do not have confirmed probability calibration.
- No causal impact evidence. The project contains no intervention trial establishing incremental impressions, clicks, rankings, conversions, or revenue.
- Scope. The 30,000-page anonymized dataset and eight held-out clients do not establish performance in every industry or new reporting period.
Future research should use time-aligned features, a prospective target, repeated client-held-out tests, reviewer feedback, and controlled intervention comparisons.
6. Ranked recommendations & action playbook
On the 7,115-page held-out set, pages are ranked by model score and assigned a descriptive reason code. These are review prompts, not validated diagnoses or autonomous publishing instructions.
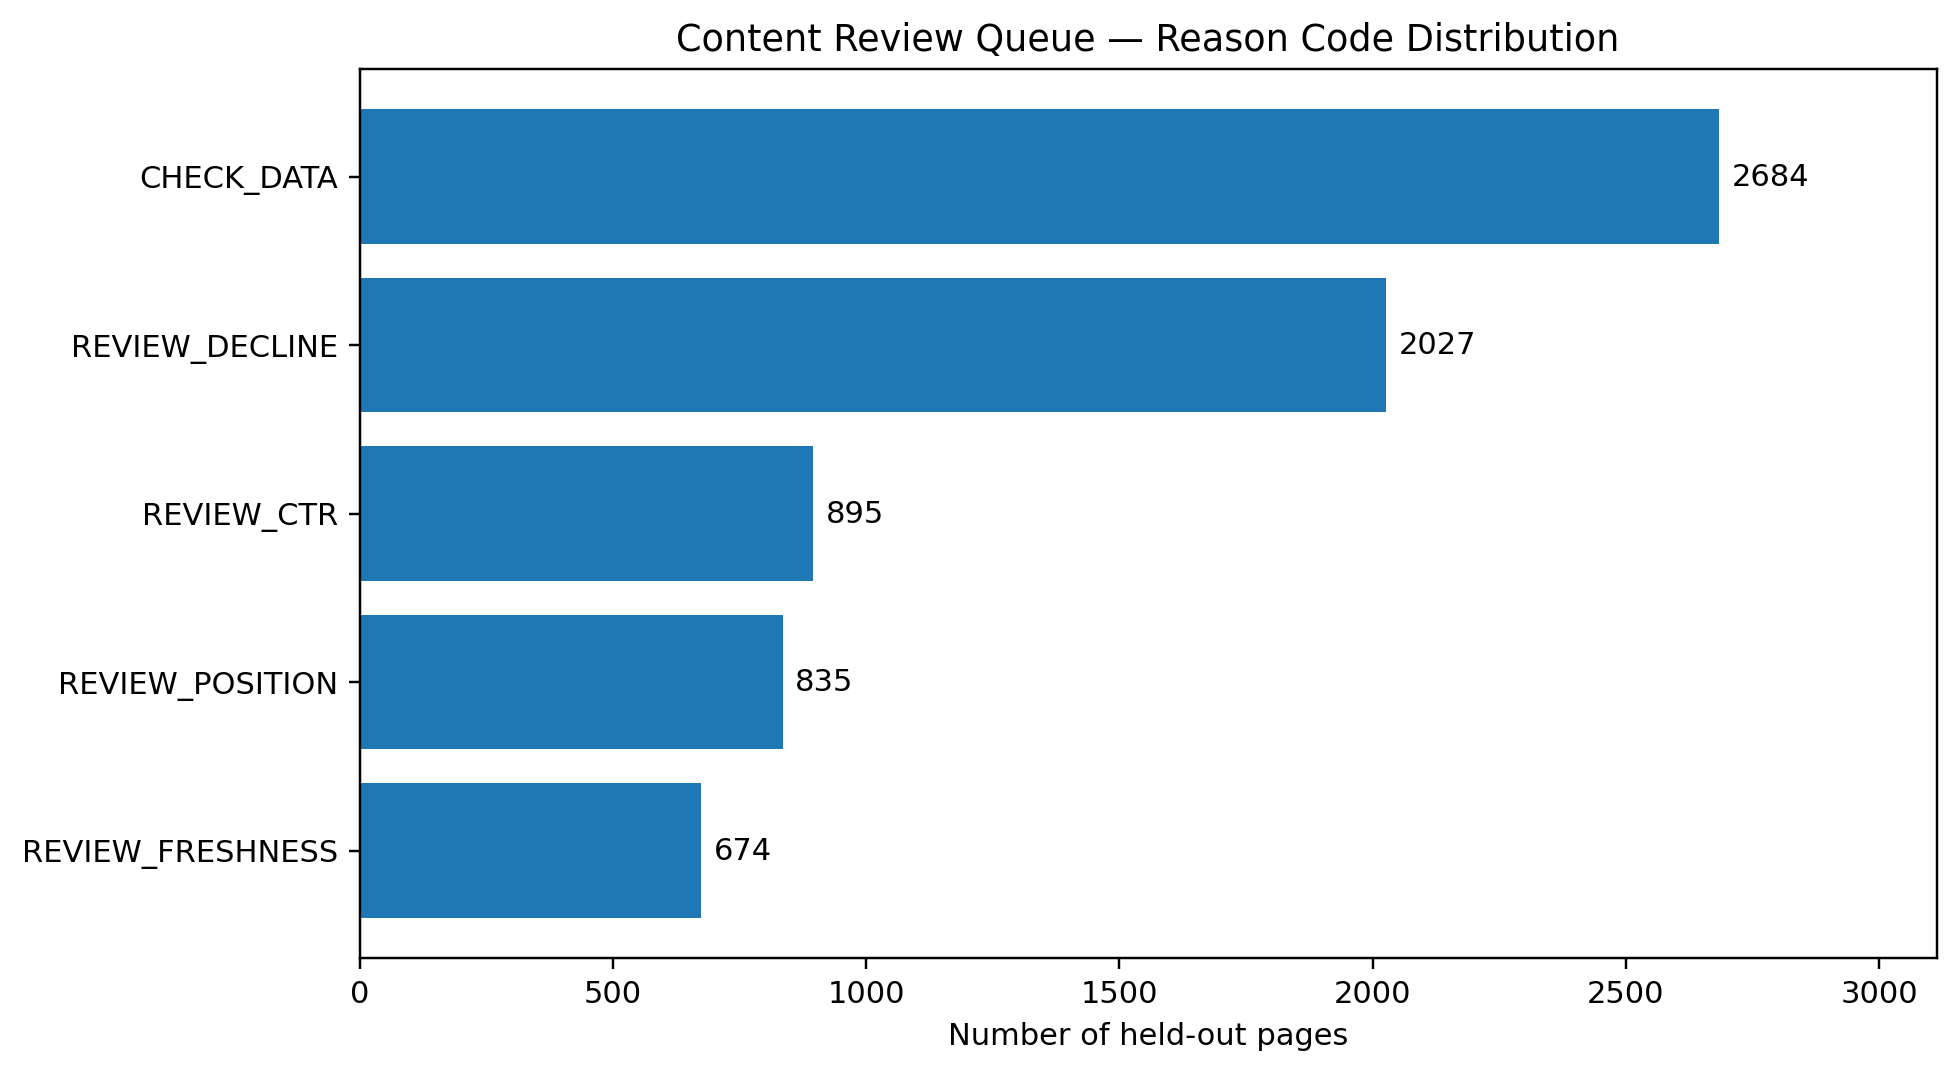
| Reason code | Pages | Proposed human investigation |
|---|---|---|
| CHECK_DATA | 2,684 | Verify tracking and search-demand evidence |
| REVIEW_DECLINE | 2,027 | Investigate observed performance signals |
| REVIEW_CTR | 895 | Inspect snippets and query intent |
| REVIEW_POSITION | 835 | Examine coverage, relevance, and internal links |
| REVIEW_FRESHNESS | 674 | Check mature content for outdated material |
About 37.7% of the queue falls under data or demand verification. This is an important operational caveat: prioritization should begin with evidence quality, not immediate rewriting.
Editorial process
- Confirm data completeness and the page's search context.
- Review content relevance, facts, and user intent.
- Estimate editorial effort alongside observed visibility and business relevance.
- Approve, revise, defer, or reject the proposed action.
- Monitor outcomes after approved changes without assuming they were caused by the intervention.
What must not be automated: publishing, rewriting, deletion, deindexing, canonical changes, unverified factual claims, sensitive-topic changes, and client-data disclosures. All actions have PENDING_REVIEW status and require human authorization.
Monitoring principles
Proposed checks include Precision@50 on newly reviewed examples, input missingness, changes in feature distributions, review rejection rates, and editorial backlog. Retraining should follow investigation and a fresh grouped or time-aware evaluation, not a single triggered alert.
7. Reproducibility & research artifacts
The analysis uses Python, pandas, NumPy, scikit-learn and Matplotlib. The primary random seed is 42. Notebooks provide the actual split construction, model configuration, training-only preprocessing, ranking rules, metric computation, and figure generation.
To reproduce, clone the repository, install the dependencies specified in requirements.txt, and execute the capstone notebook against the authorized anonymized starter sample. The Week 7 notebook regenerates its ranked queue CSV; raw page-level queue exports are deliberately not committed to Git.
Supporting metrics: capstone_metrics.json · w07_action_metrics.json.
8. Acknowledgments & data credit
Built on the FlyRank ML Internship dataset.
I acknowledge FlyRank for the internship research framework, anonymized dataset, and opportunity to study practical search-performance questions. Interpretations and conclusions on this page are the author's research findings and are not official product-performance claims by FlyRank.
Public-safety scope: this page contains aggregate evaluation findings and methodology only. No client names, domains, page URLs, private queries or credentials are presented.